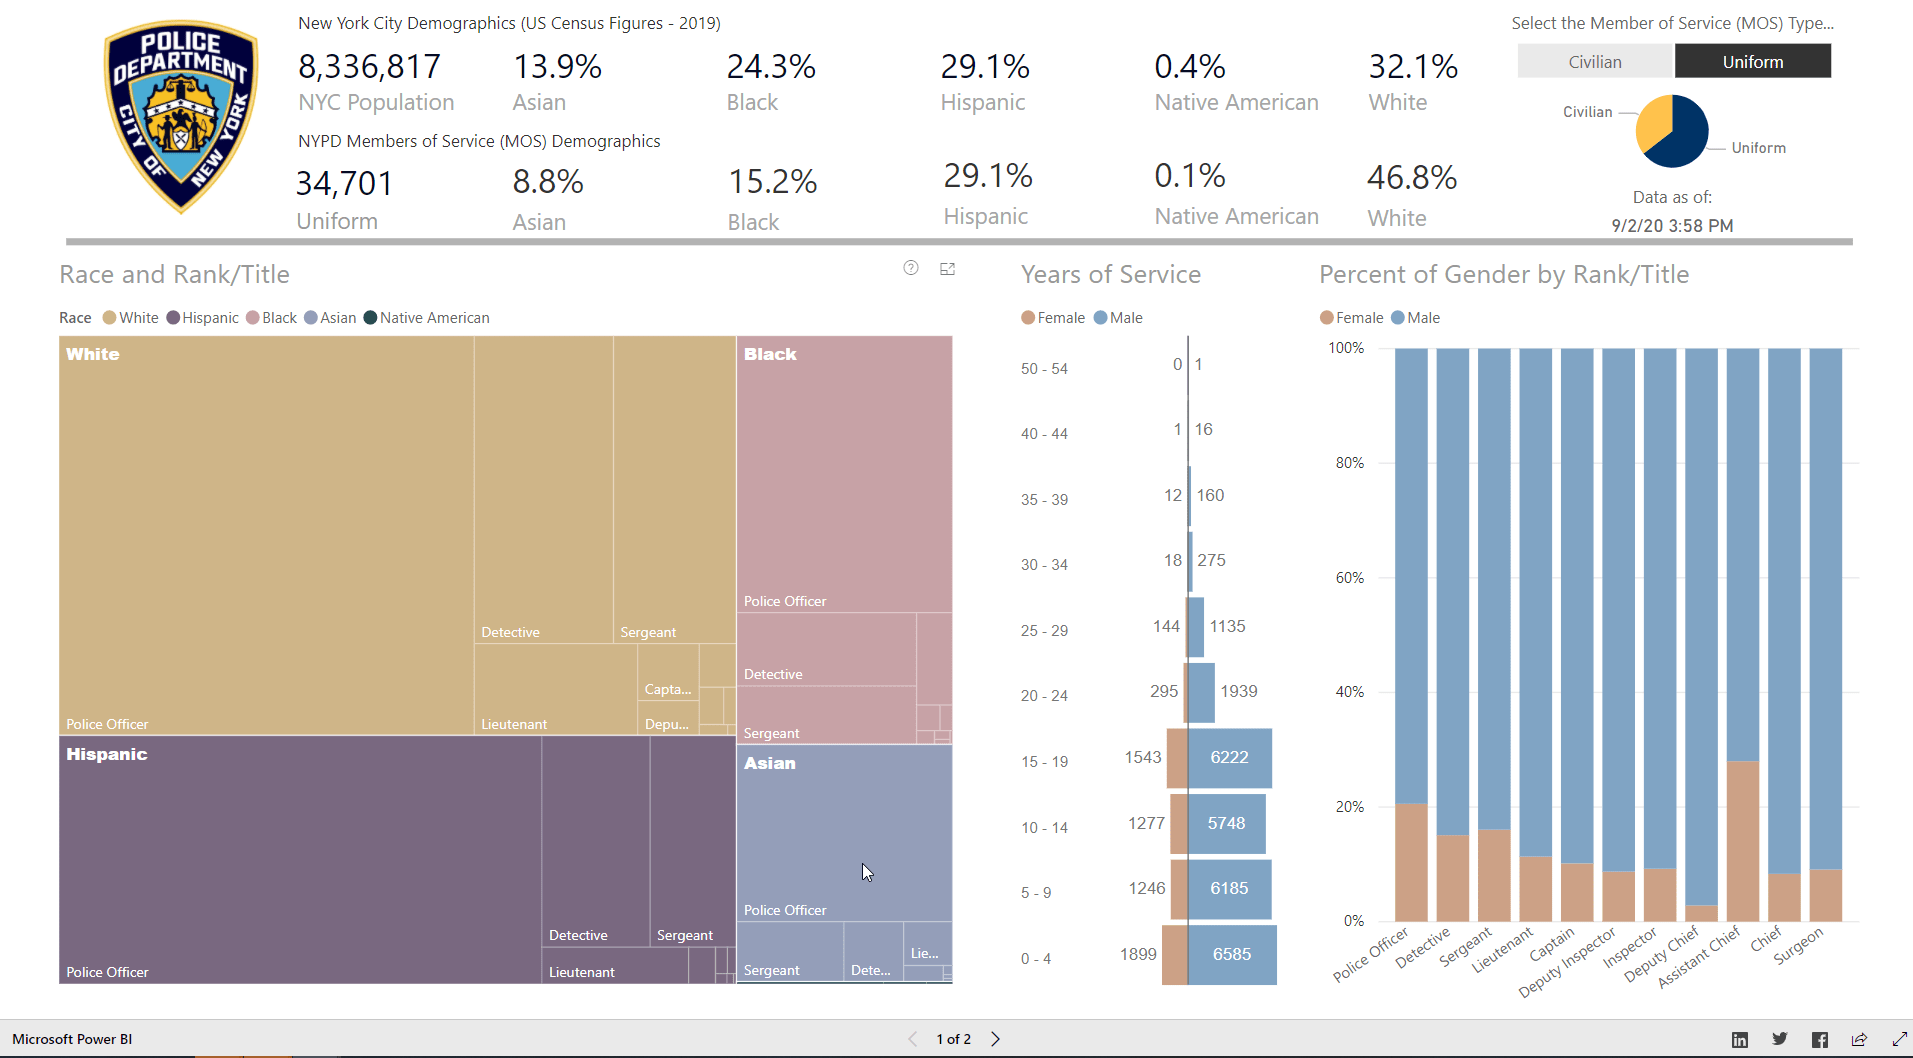
New York City is using Power BI to provide transparency on hate crimes and NYPD personnel.
https://www1.nyc.gov/site/nypd/stats/reports-analysis/reports-landing.page
I have had many conversations recently around transparency in law enforcement including hate crimes, hiring/training and use of force.
I like how NYPD used the shape map and word cloud visuals. They also followed best practices and included a “last refreshed” time.